

By Debleena Majumdar
Co-Founder
Kahaniyah, Corporate and Educational Institutes
“Maybe stories are just data with a soul.” said Brené Brown. Do you agree?
The year was 1854. London had been reeling under the outbreak of cholera and Doctor Charles Snow was one of the tireless doctors treating an endless stream of patients even as he found himself asking questions about the real reason behind the spread of the disease. His hypothesis was that cholera could spread through contaminated water. The common perception at that time was the cholera spread through air. But as Dr. Snow mapped out cases of cholera on the map of London (each black dot in the chart below is an incident of cholera in what is believed to be an early usage of a histogram on a map), he found the cases converging around one street, Broad Street. Investigations showed that that street indeed had a septic water tank which led to a large outbreak. One single chart conveyed what years of research had been trying to.

The drama of data:
Many of us in the world of Analytics got introduced to the concept of data storytelling with this powerful video on population growth and climate change by Hans Rosling:

Using rapidly shifting bubble charts, he tells a powerful data story. A text-book introduction to the power of visualization of data. So much so that a lot of people now talk of data stories as just visualization. But can visualization alone tell the story?
My hypothesis - Hans Rosling and Charles Snow not only used data and visualization, but actually used stories that lie lurking beneath the data to get to that powerful visual. The visual was the output but without the story it had no insight. So can stories uncover insights?
Let’s look at at two examples to understand the journey from data to story-based insights more clearly.
Spotlight on Spotify:
The data: Spotify kicked off its largest-ever global campaign with a major, data-driven outdoor push in which it bade goodbye to 2016 with the sign-off, "Thanks 2016, it's been weird." Rolled out across more than 10 markets, it used hyperlocal data to create messages which are personalized and rang true with what people felt and listened, when the the world around them kept showing more signs of weirdness.

The story based insight: Spotify CMO, Seth Farbman, is reported to have said that the idea for this data-driven campaign originated with 2015's end-of-year "Year in Music" campaign, as data from listeners in different geographical areas provided some interesting insights. "That led to the idea of reflecting culture via listener behaviour."
"There has been some debate about whether big data is muting creativity in marketing, but we have turned that on its head," he added. "For us, data inspires and gives an insight into the emotion that people are expressing."
The result: With the campaign rolled out in November 2016, the real results will only be measured later. From early reviews, most people loved the creativity and the humor displayed in the ads. But there were a few questions around the moral code of data stories and concerns as to whether the personal data that the customers trusted Spotify with when they signed up was compromised in any way in developing ads like this.
No words to say the Last Words:
The data: Indian Association of Palliative Care (IAPC) wanted to raise awareness about the lack of palliative (end-of-life) care that patients receive, robbing them, often, of dignity, at death. According to their studies, only one in 100 patients get access to any sort of palliative care with the result that most last words are heard, not by family, but by nurses. They had conducted interviews with over 200 retired and working nurses across India and had data and facts on this issue.
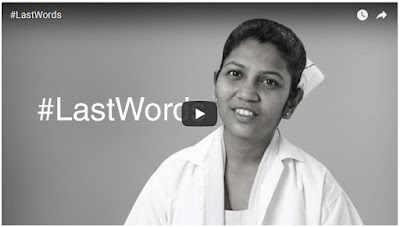
The story based insight: For Praful Akali, Founder & Managing Director of Medulla Healthcare Communications, the agency which conceptualized and created the awareness campaign for IAPC, the data was disturbing. It was a story that needed to be told to raise awareness about the importance of palliative care. But the true insight came from the words the nurses spoke, the real stories behind the data. And that insight led team Medulla to create the video #last words – the last words of dying patients, which were meant for family members, but instead, often heard by nurses and medical staff, when they passed away. Palliative care aims to change this type of end-of-life care, as the video describes, giving patients “every possible comfort during their last days, including letting them spend time with loved ones.” Imagine if Medulla just created an infographic that charted out all the data. Would it tell the story, so powerfully? They went beyond the data to the story to get the real insights.
The result: Not only has the video gone viral, sparking over 100 million conversations on social media while sending a powerful message on end-of-life care; at the Cannes Lions 2016, Medulla was awarded as the Healthcare Agency of the Year with "Last Words" bagging two gold medals. No wonder then that in Brand Equity’s “Best & Bekaar Advertising of 2016” it topped the list of Best Ads of 2016. For a small firm with limited budget that works in the area of Healthcare Advertising, which is not supposed to lend itself to very creative marketing, the results speak volumes about the power of the story based insight.
Not just in marketing but across all business functions; stories have the power to lead the journey from data to insights. And just like any narrative story arc, the insights-based-story too needs to have all the elements of a good story - the character, the conflict, the resolution and the authentic voice of the storyteller. Only then can insights shine.
“A single death is a tragedy. A million deaths is a statistic,” Stalin is supposed to have said. Whether we are talking about life, death or music or cola, as data storytellers, we owe it to our data, and to ourselves, to tell the right stories - which use data correctly, convey the right insight and hopefully, drive decisions and change.
Would love to hear your stories.
I use storytelling to improve business and learning outcomes through workshops and projects. If you are looking to improve your teams’ understanding of your vision, trying to implement your data-driven strategy or just trying to enhance the way you listen to or sell to your customers, email me at debleena.majumdar@gmail.com to see how storytelling can sharpen your results.